Results
 Overview
  No Brainer
  Raw Data
  Trend Analysis
  Averaged Results
  Summary
  Overview
The exhibitor is using a maze generation program that was found on the
Internet from Bob Kirkland (with permission).It is important to compare the different mice on the same maze. To do this, the exhibitor's father changed the program to make a copy of each maze puzzle for each mouse. This means for each puzzle the mice solve the same maze.
For each puzzle the maze-solving engine will go through the maze by calling the Mouse's makeAMove method until it gets to the end of the maze. It also counts the number of moves that were made.
 No Brainer
The first test that was run was to simply compare the two mice that
use a random strategy (ScatterBrained and Randy). The
only difference between these classes is Randy has a memory,
because it derives from Smarty. The results are shown
below:
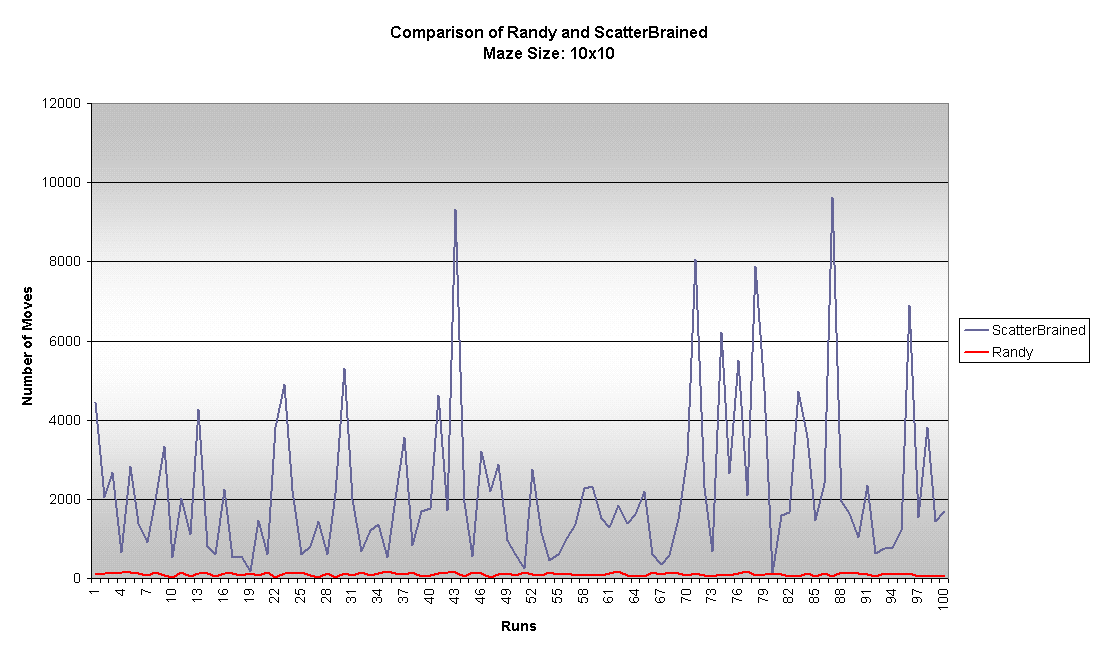
Randy always took fewer moves to solve the maze so it is better to have memory.
 Raw Data
The remainder of the tests that were run compares the mice that have
memory (ones that derive from Smarty).This project had a lot of data that had to be analyzed. Seven different mice were compared. Three different size mazes were used. Because the computer was used to gather the data, it was run overnight, resulting in over 5,000 different maze puzzles. So 105,000 data points were analyzed (5,000 mazes * 3 maze sizes * 7 different mice).
Here is a sample of the data that was run for the 50x50 maze. The complete set of data is 5,000 lines long (over 100 pages … just for the 50x50 maze). Each line shows the number of moves it took for the mouse to solve each maze puzzle.
| Randy | Randy | NESW | SWEN | FocusedR | FocusedL | Goaly |
|---|---|---|---|---|---|---|
| 2444 | 3564 | 4464 | 750 | 1908 | 918 | 618 |
| 3324 | 1226 | 1658 | 706 | 1016 | 896 | 3338 |
| 3176 | 1434 | 588 | 4406 | 842 | 3432 | 576 |
| 1814 | 3108 | 2340 | 1500 | 3086 | 3120 | 2632 |
| 2000 | 2910 | 2046 | 2984 | 4120 | 3908 | 2722 |
| 4336 | 4384 | 1698 | 3208 | 3998 | 3960 | 1032 |
| 1826 | 3032 | 2658 | 2338 | 3320 | 2972 | 2624 |
| 1328 | 1784 | 3150 | 2418 | 2534 | 2950 | 1720 |
| 2494 | 2008 | 1596 | 3402 | 3928 | 3124 | 2926 |
| 3140 | 1402 | 1120 | 3968 | 4214 | 3766 | 3736 |
| 3240 | 1646 | 1066 | 4138 | 3358 | 3338 | 2714 |
| 2004 | 2300 | 4466 | 226 | 3080 | 1392 | 430 |
| 3028 | 1482 | 1656 | 3342 | 2620 | 3266 | 1610 |
| 3142 | 1796 | 1120 | 3962 | 932 | 2442 | 1460 |
| 4076 | 3198 | 3288 | 1668 | 1776 | 862 | 754 |
| 4192 | 3752 | 4638 | 2944 | 2248 | 1600 | 2920 |
| 4186 | 3370 | 2118 | 3662 | 2146 | 1824 | 2320 |
| 3032 | 1906 | 2046 | 3404 | 2650 | 1388 | 240 |
| 1730 | 1248 | 2798 | 2752 | 1176 | 808 | 1796 |
| 2502 | 2876 | 1998 | 2884 | 3688 | 2670 | 1456 |
| 2920 | 3614 | 2520 | 4148 | 1322 | 1646 | 948 |
| 1972 | 390 | 2644 | 2004 | 2014 | 2282 | 2434 |
| 3608 | 1026 | 1678 | 3328 | 1302 | 1776 | 3178 |
| 1988 | 1854 | 4170 | 556 | 1330 | 1708 | 2244 |
| 2846 | 3398 | 4534 | 1712 | 2528 | 1264 | 380 |
| 2522 | 2562 | 1504 | 3494 | 2266 | 3538 | 1388 |
A chart that plots these data points is not clear.

We definitely needed to find another way to look at the data.
 Trend Analysis
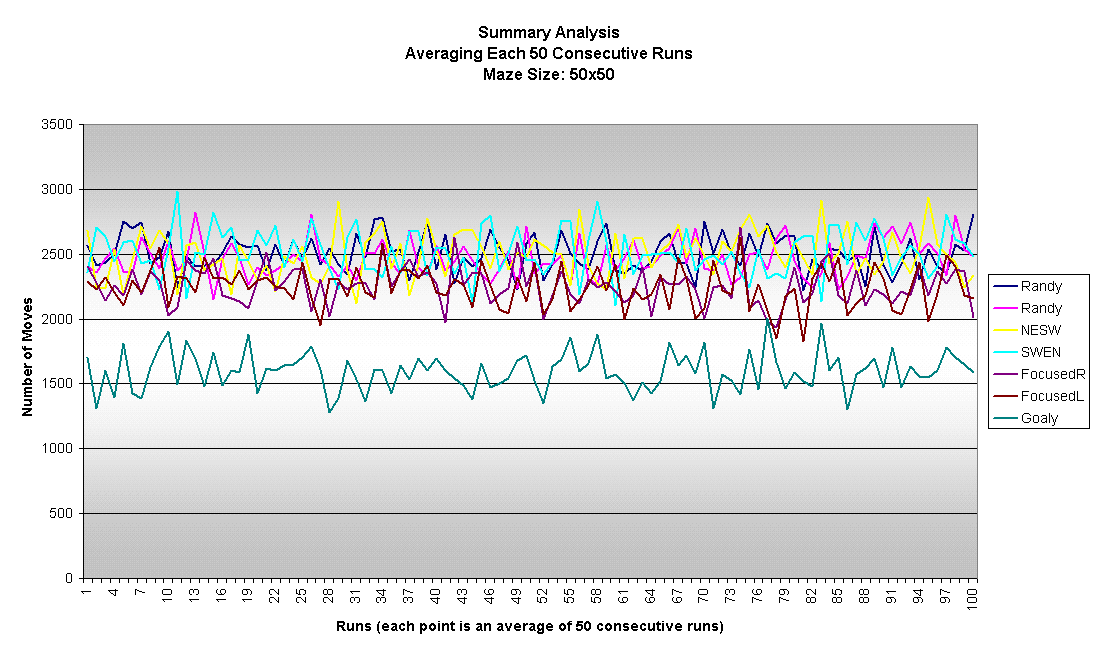
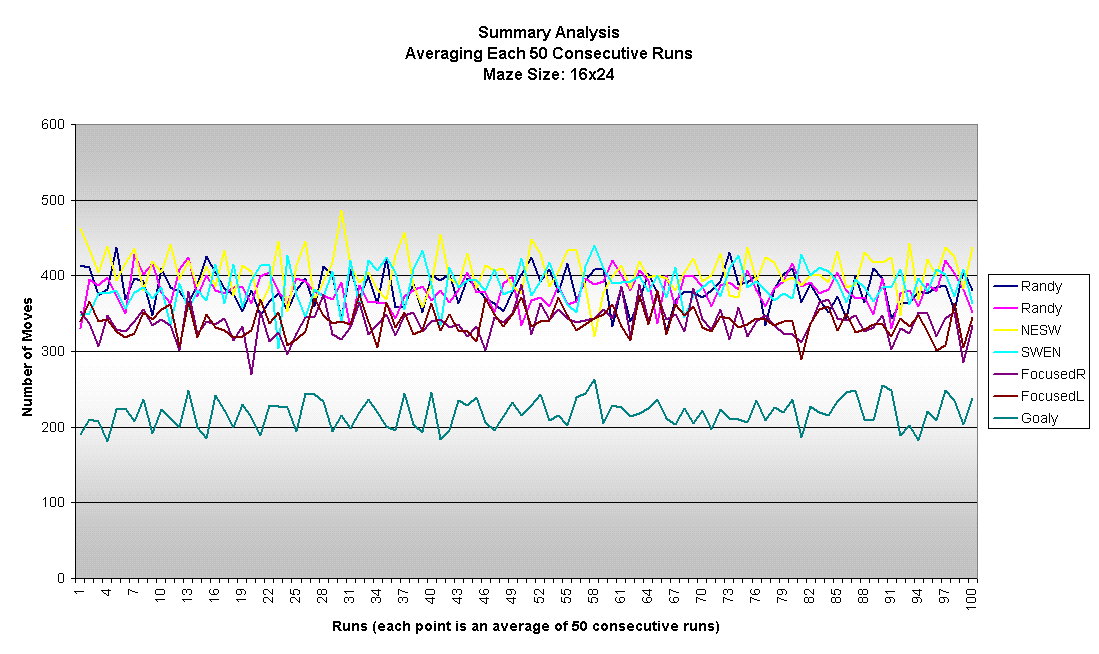
The exhibitor made 50 data points into one data point by averaging
them together and plotting these averages to see if there was a trend.
The purpose was to see who made the least number of moves over all the
tests.Here are the averaged results for the 50x50 maze:
Here are the averaged results for the 16x24 maze:
Here are the averaged results for the 10x10 maze:
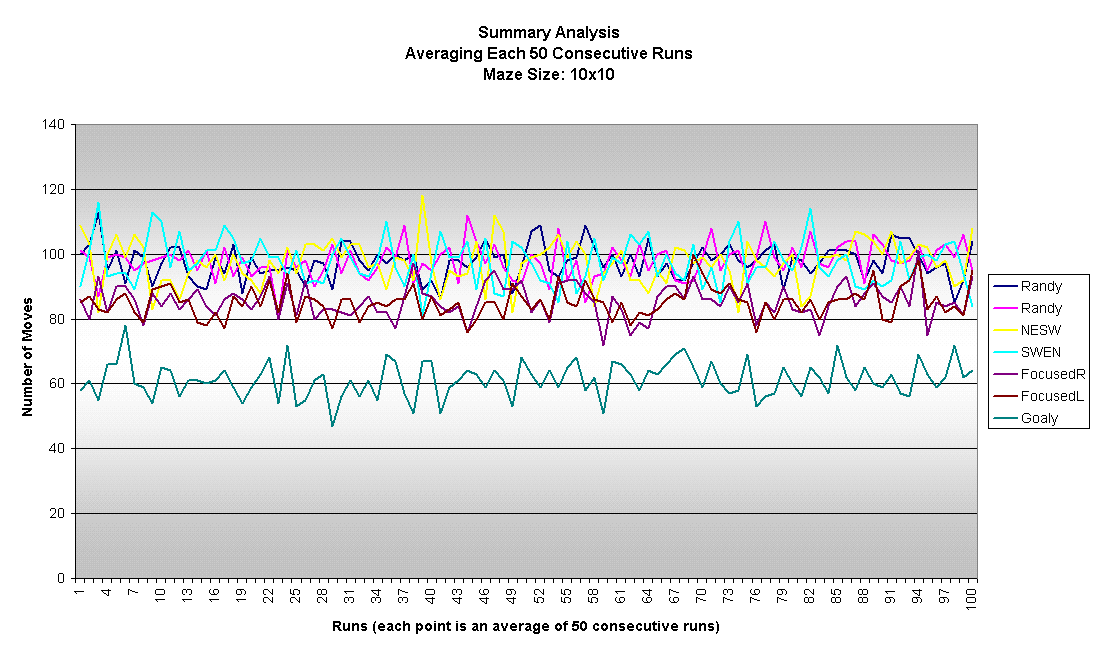
These summarized charts show a trend that repeats over and over again.
 Averaged Results
Since there is a trend, the average number of moves for each mouse was
plotted for each maze size that was run.Here are the averages for the 50x50 maze:
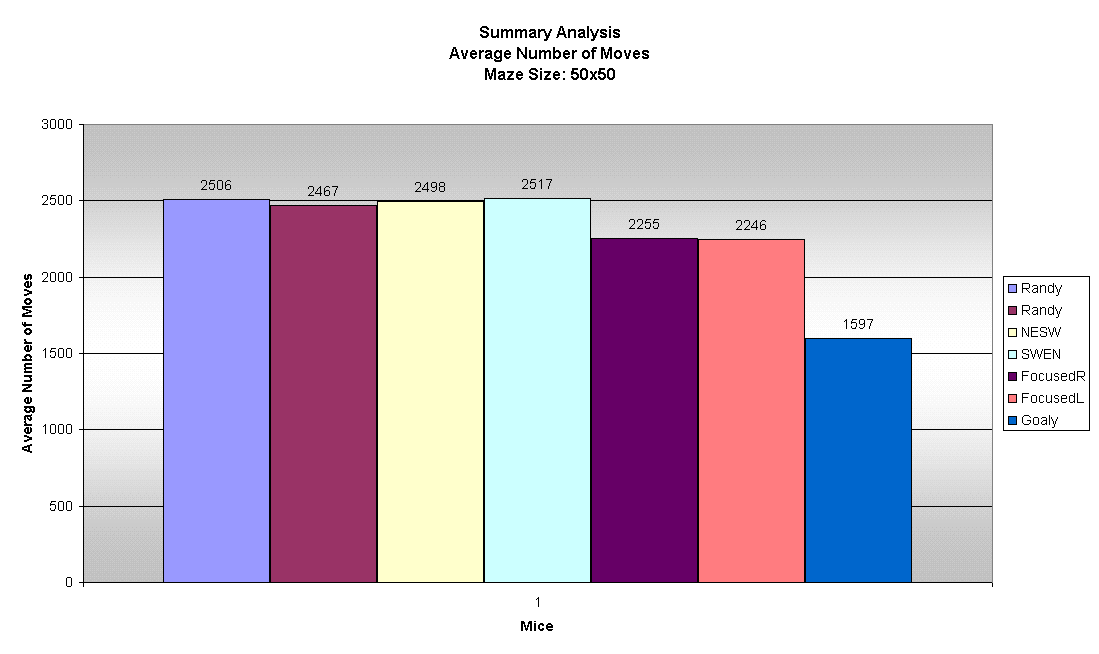
Here are the averages for the 16x24 maze:
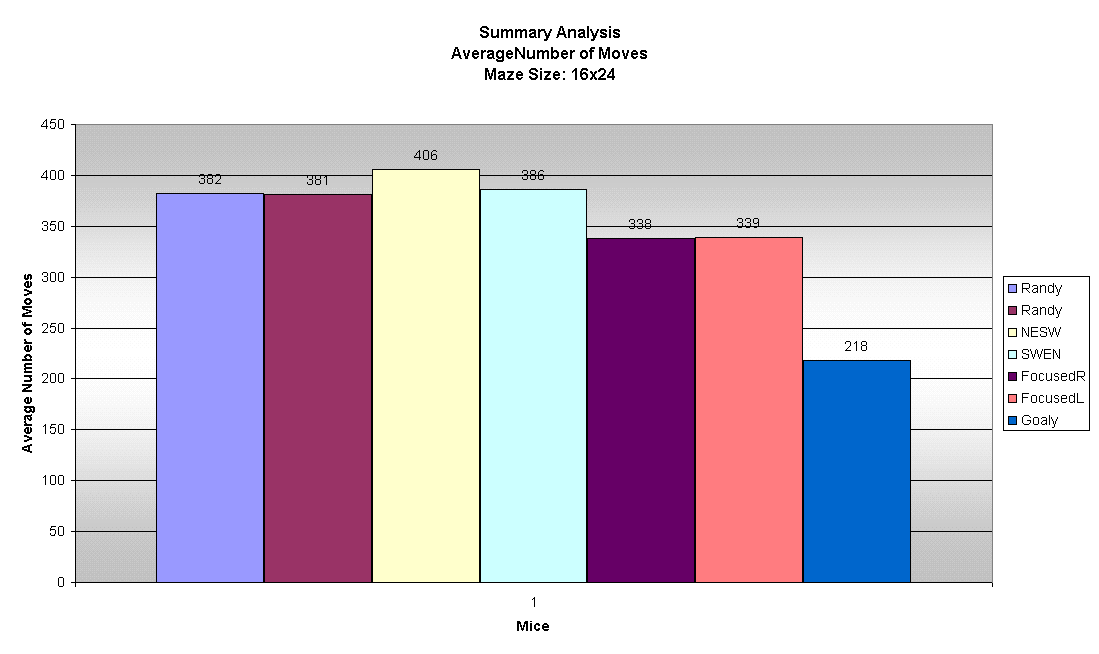
Here are the averages for the 10x10 maze:
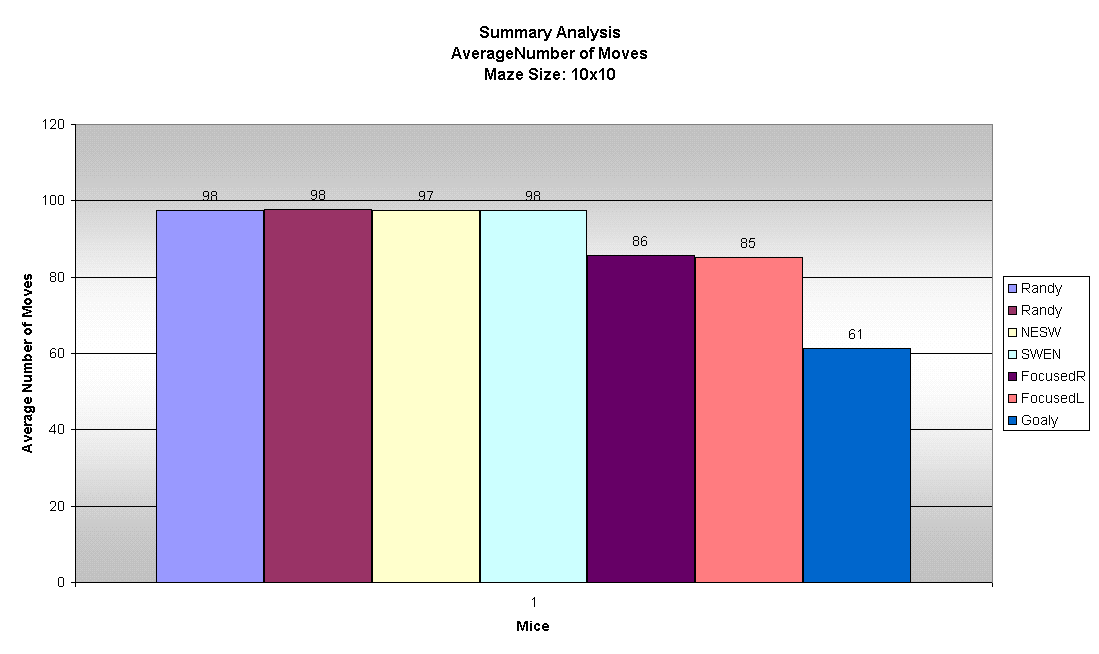
 Summary
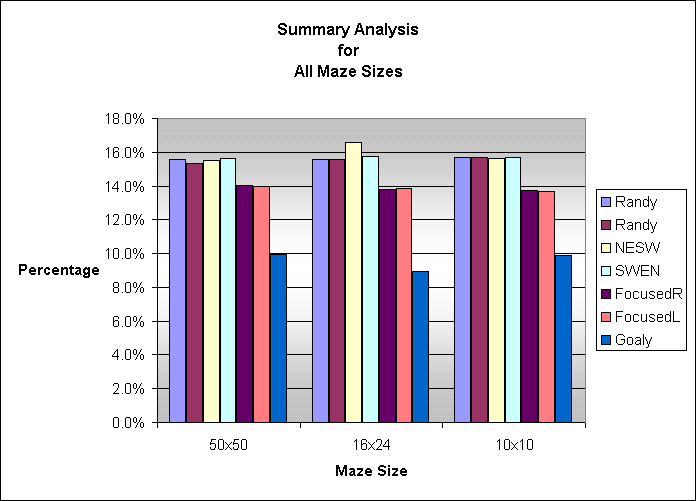
To compare the different size mazes the exhibitor put them in
percentages, by dividing each score by the total scores for all mice.
This shows Goaly always wins no matter how complex the maze.
